Choose the days that count.
Review today, a week, a year or your own dates. Today compares with the same weekday last week. Short yearly comparisons also keep weekdays aligned.
See what sold, when you were busy and how trading compares. Open the detail in Tillable, then give your bookkeeper a copy.
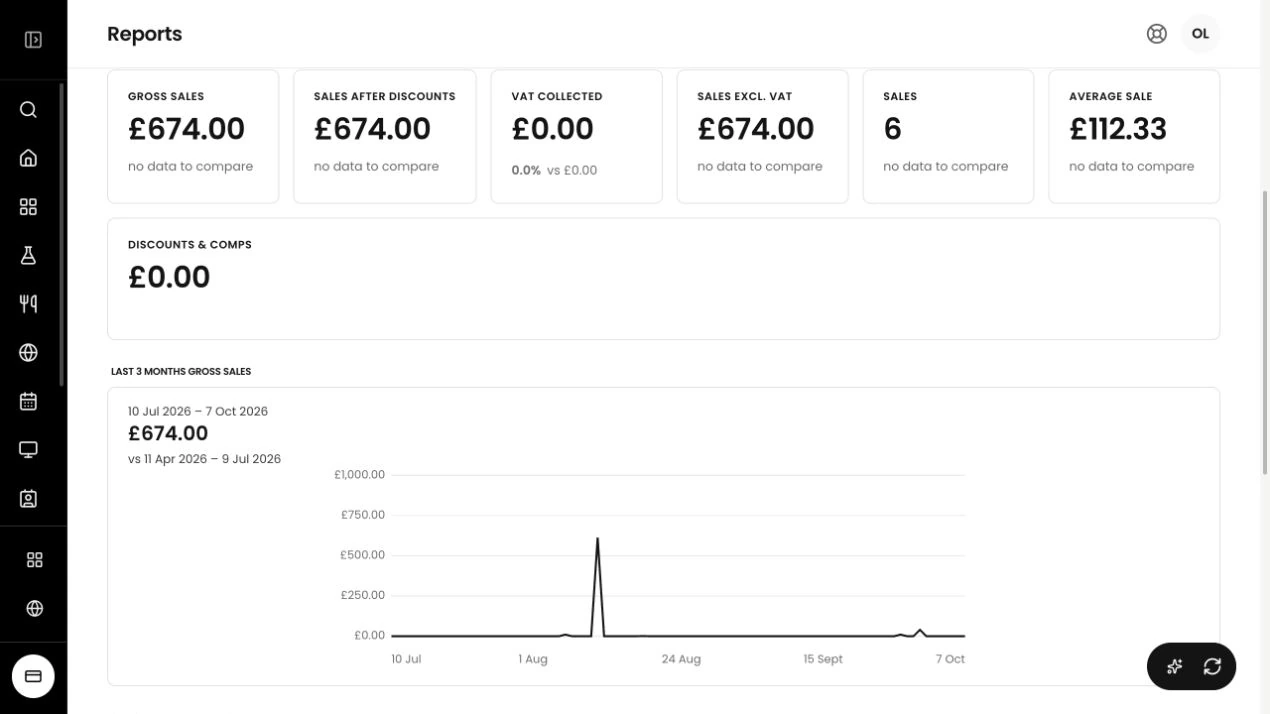
A busy weekend can hide a quiet week. Put two periods on the same chart and see where trading changed.
Review today, a week, a year or your own dates. Today compares with the same weekday last week. Short yearly comparisons also keep weekdays aligned.
Filter by location or terminal to narrow the figures. Copy the report link to return to those dates and filters.
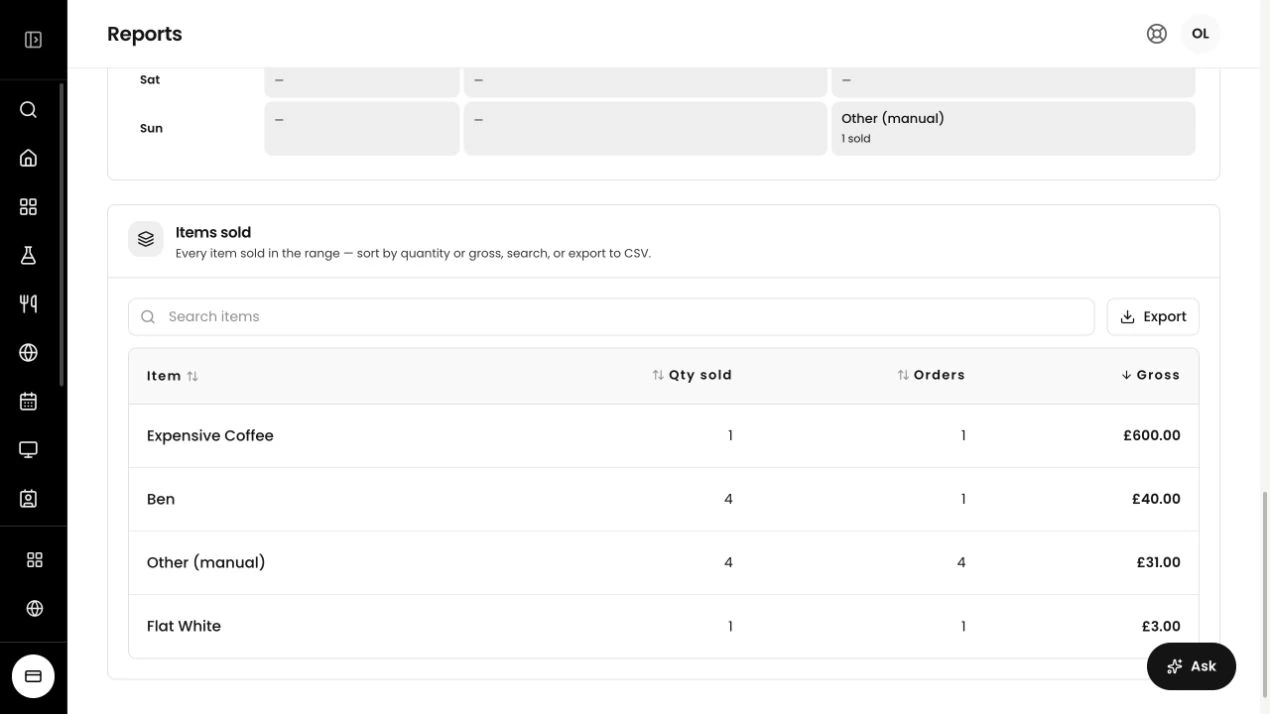
A total tells you how much you took. The item list and hourly view show where it came from.
Sort your items by sales value or quantity. See which products earn the most and which you sell most often.
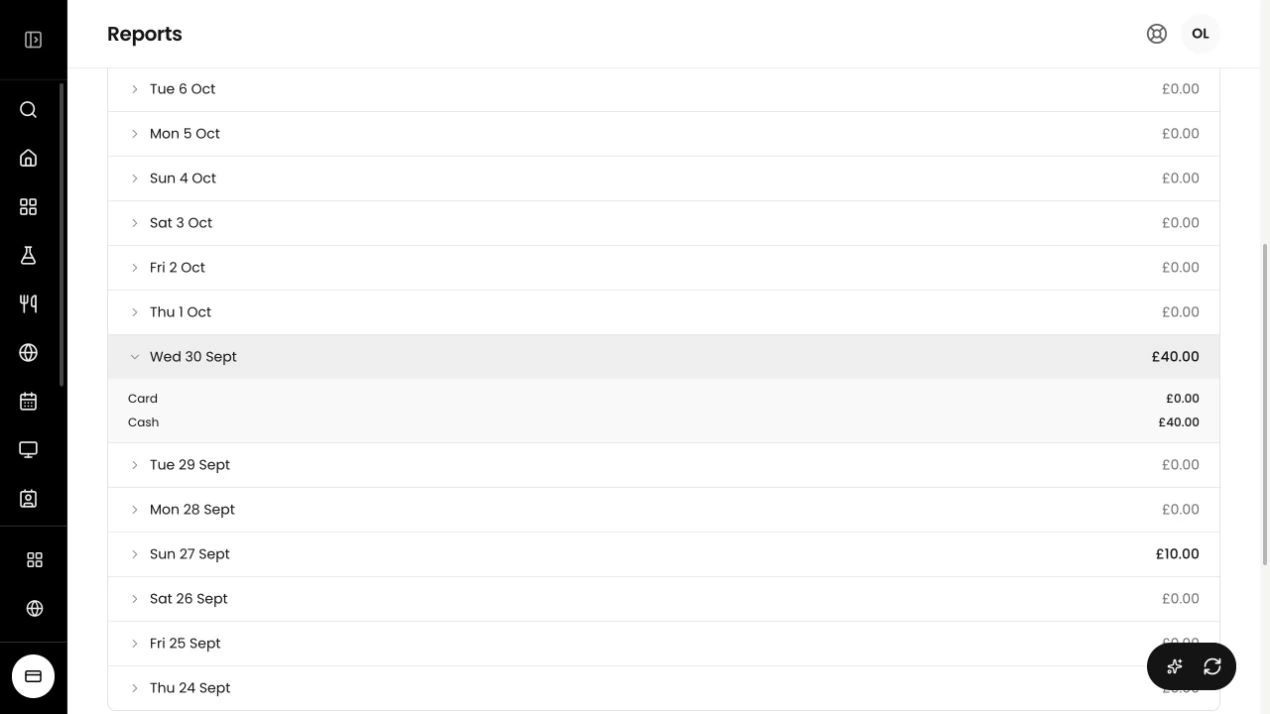
Open End of Day to check your daily totals and how the money came in. Choose a day, a week or another date range.
Check cash and card takings, with gift cards shown where they were used.
Tips have their own figures, so you can read them without adding them to your sales total.
You can keep working in Tillable and hand over a copy when it’s time to do the accounts.
We’re exploring ways for your own AI agent to query Tillable reports. Tell us which questions you’d like it to answer.
See how Payments, Menu Management and Accounting fit into recording and reviewing your takings.
Yes. Filter the report by location or terminal. The figures and comparisons use the filters you’ve selected.
Export report tables as CSV files. You can also print End of Day figures without the navigation and controls. A copied report link keeps your filters; it does not give someone access to your account.
Choose today, a week, a month or a year, or enter your own date range. Today is available hour by hour.
For short date ranges, Tillable shifts the comparison by whole weeks so the weekdays line up.
Agent reporting through MCP is under consideration. Contact us for the current status and supported access before planning a connection.

See which products sold, when you were busy and what changed from the week before.